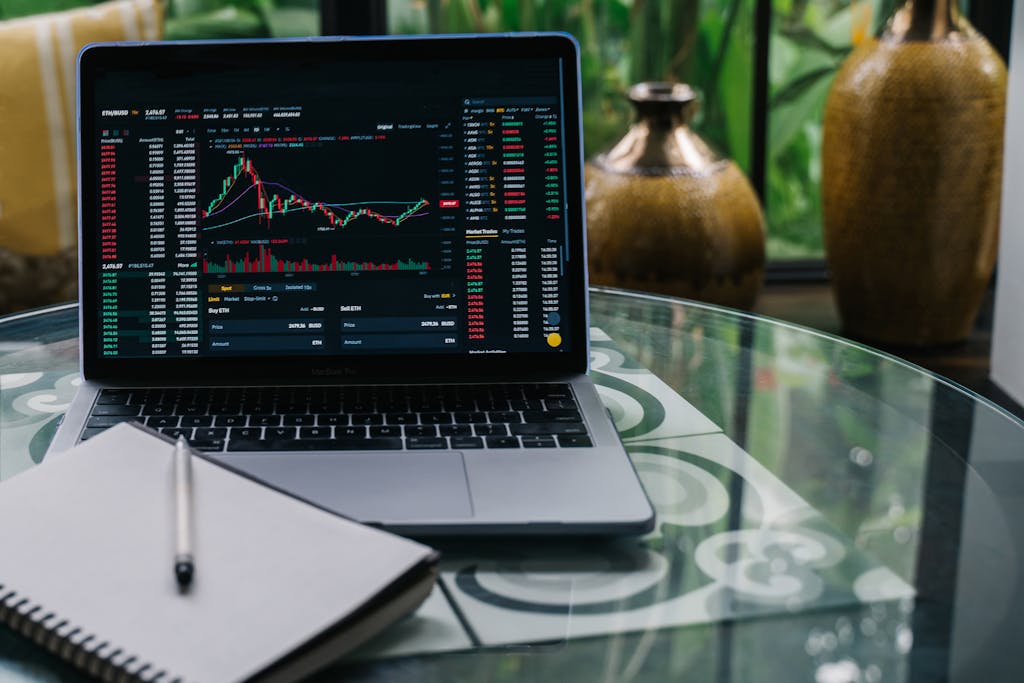
How to Analyze Trading Graphs
How to Analyze Trading Graphs: A Beginner’s Guide to Crypto Market Analysis

Understanding trading graphs is crucial for anyone who wants to succeed in the world of cryptocurrency. Whether you’re a seasoned trader or just starting, the ability to read and analyze charts can significantly impact your trading strategy. In this article, we’ll dive into the basics of analyzing trading graphs, focusing on the key elements you need to understand to make informed trading decisions in the crypto market.
What Are Trading Graphs?
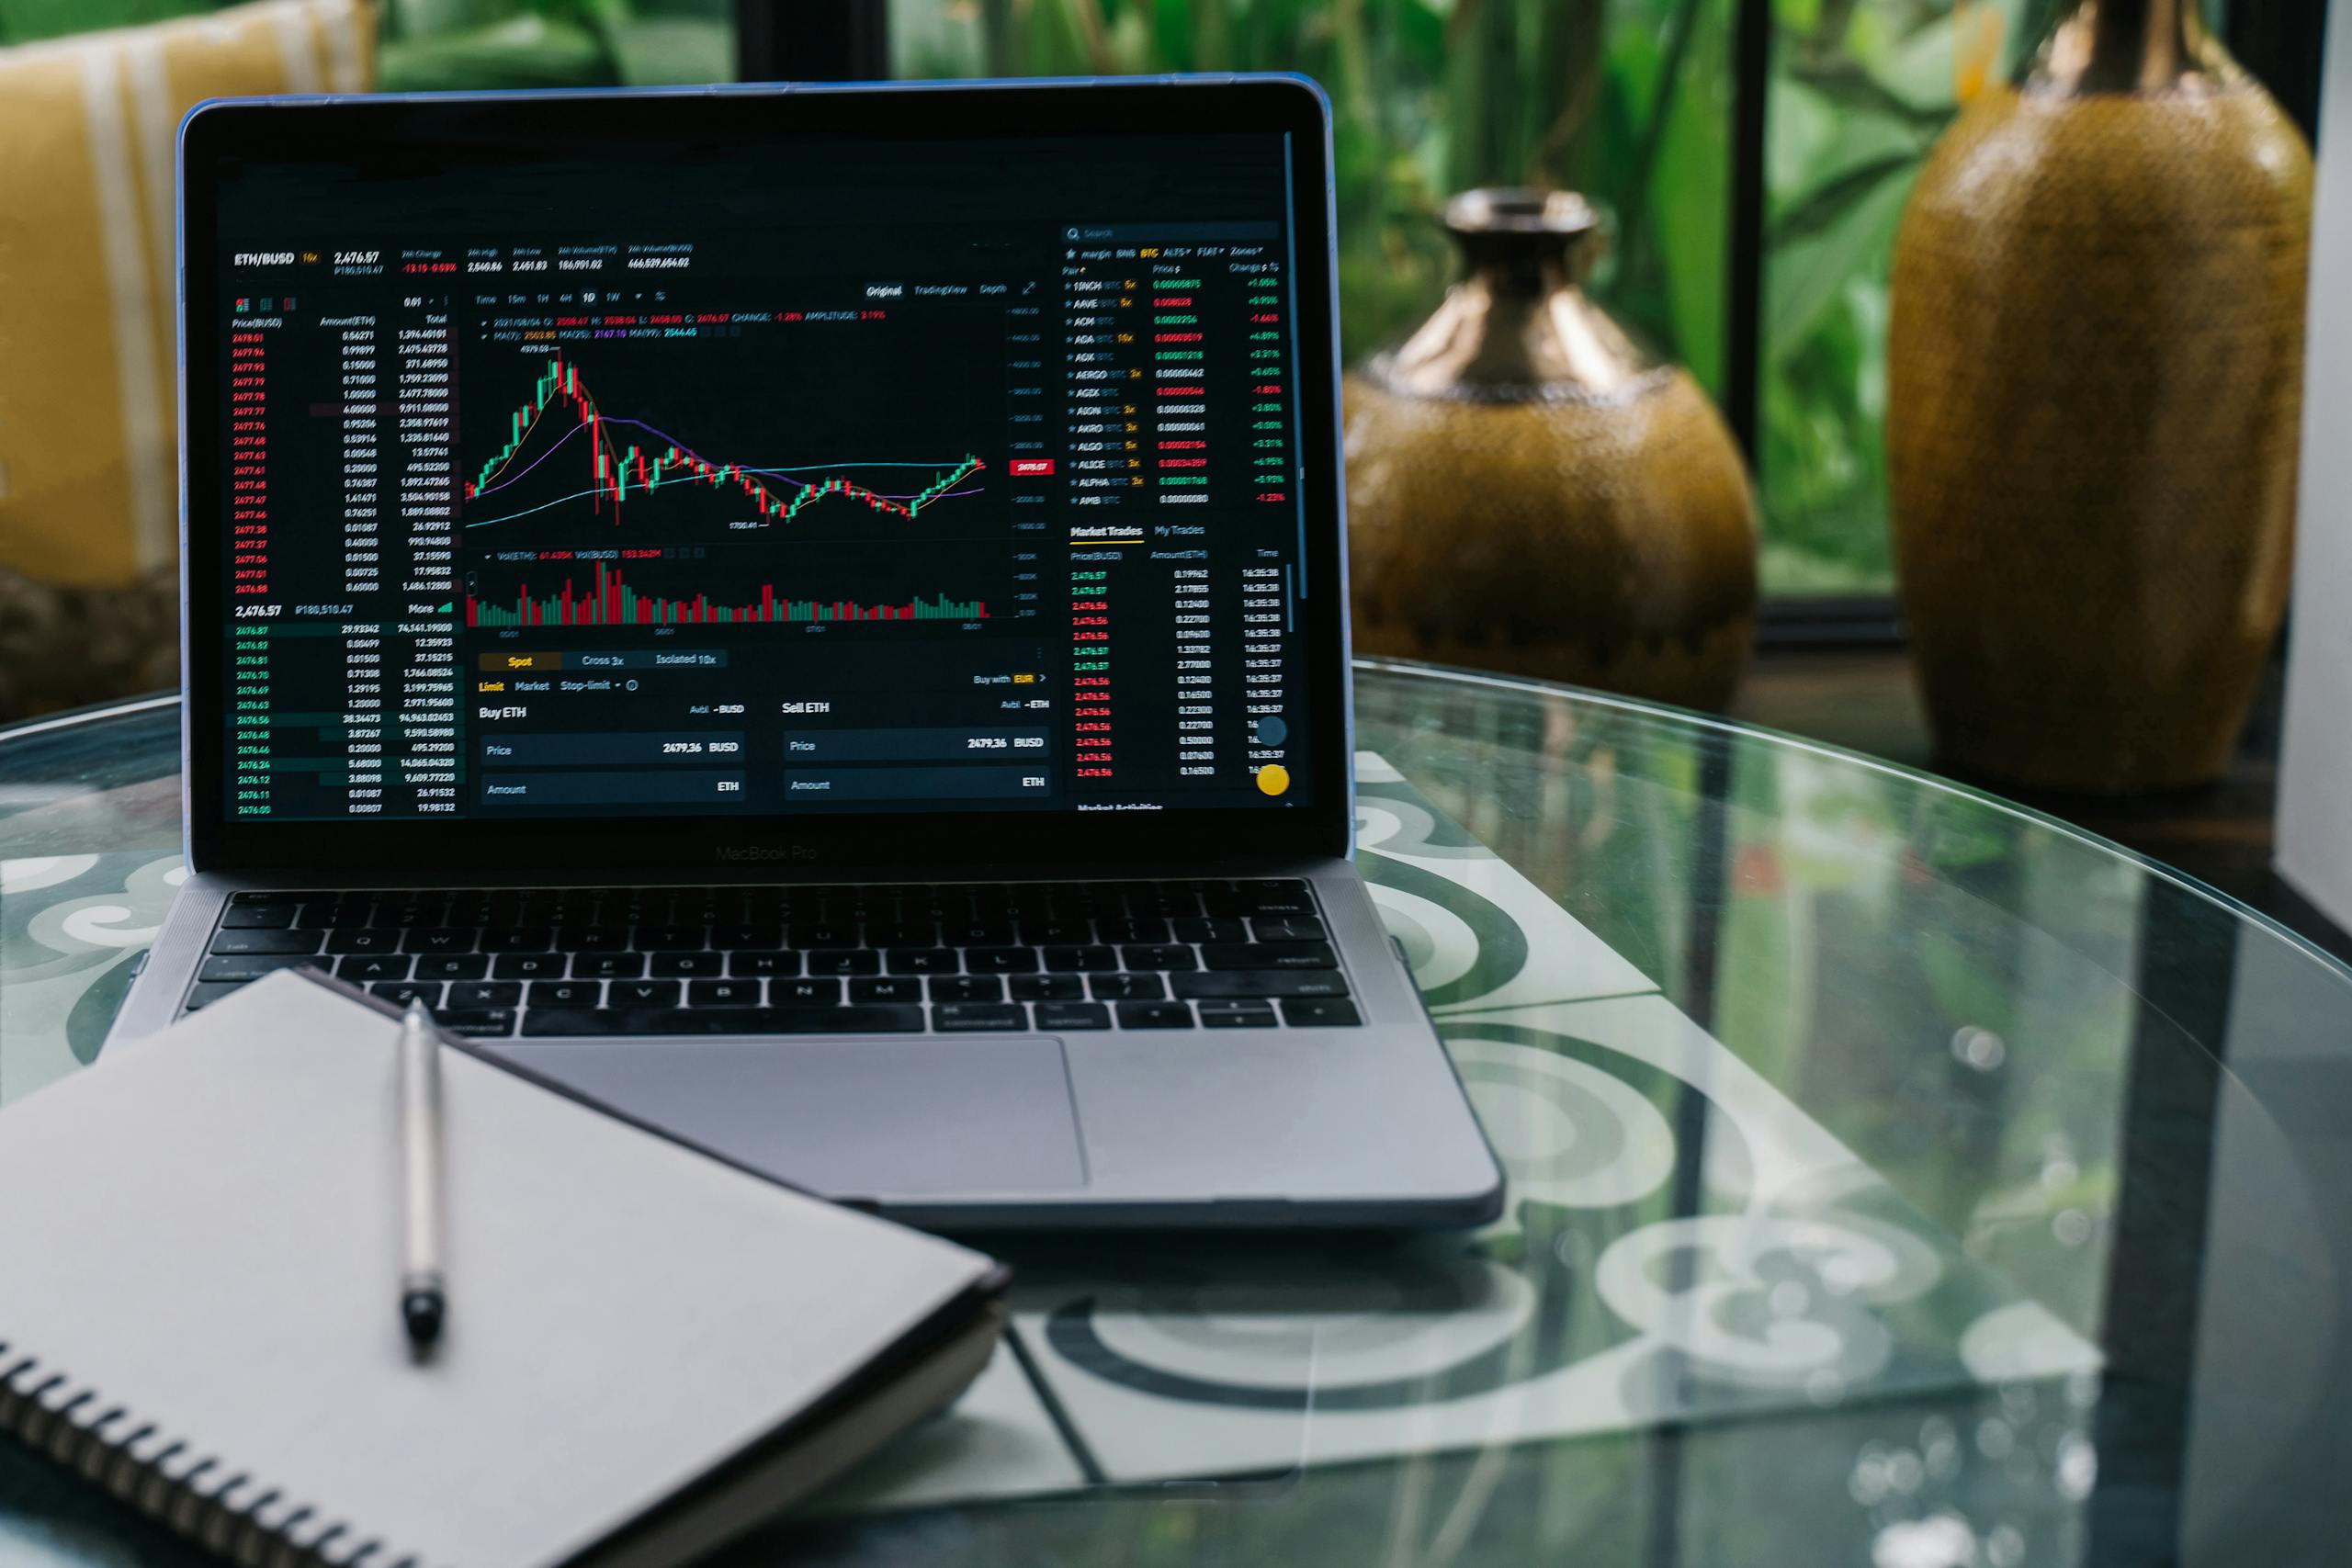
Trading graphs, also known as price charts, visually represent the price movement of a cryptocurrency over a certain period. These graphs allow traders to track price changes, identify trends, and spot potential market reversals. The most common types of trading graphs include line charts, bar charts, and candlestick charts. For cryptocurrency traders, candlestick charts are the most popular, as they provide the most detailed information.
Key Elements of Trading Graphs:
- Price Axis: The vertical axis shows the price of the asset.
- Time Axis: The horizontal axis represents time.
- Candles/Bars: These represent price movements for a specific time period.
- Volume: The amount of trading activity, shown as bars beneath the price chart.
By understanding these components, you’ll be able to make sense of the crypto market and spot profitable opportunities.
How to Read Candlestick Charts
Candlestick charts are the most widely used method for analyzing trading graphs in the crypto world. Each “candlestick” represents the price action of an asset for a specific time period, ranging from minutes to days, depending on the trader’s time frame.
How a Candlestick Works:
- Open: The price at which the candle starts.
- Close: The price at which the candle ends.
- High: The highest price during the time frame.
- Low: The lowest price during the time frame.
- Body: The rectangular section between the open and close price.
- Wicks: The lines extending above and below the body, representing the high and low of the time period.
Candlestick patterns can tell you a lot about the market’s current sentiment. For example, a bullish engulfing pattern indicates a potential price increase, while a bearish engulfing suggests a price drop.
Example of a Candlestick Pattern:
- Bullish Engulfing: A larger green candle fully engulfs the previous smaller red candle, indicating a reversal from bearish to bullish.
- Doji: When the open and close prices are nearly the same, indicating market indecision.
Key Indicators to Use When Analyzing Trading Graphs
When analyzing trading graphs, it’s not enough to just look at the candlesticks. You also need to incorporate technical indicators to help you make more accurate predictions. These indicators are mathematical calculations based on the price, volume, or open interest of a particular asset.
Popular Indicators for Crypto Traders:
- Moving Averages (MA): Moving averages help smooth out price data to identify trends over time. Common moving averages are the Simple Moving Average (SMA) and Exponential Moving Average (EMA).
- Relative Strength Index (RSI): RSI is a momentum oscillator that measures the speed and change of price movements. It ranges from 0 to 100 and helps identify overbought or oversold conditions.
- MACD (Moving Average Convergence Divergence): MACD is a trend-following momentum indicator that helps identify changes in the strength, direction, momentum, and duration of a trend.
Example of Using Indicators:
- Using RSI: If the RSI is above 70, the asset may be overbought and due for a price correction. If it’s below 30, it may be oversold and could be a buying opportunity.
- Using Moving Averages: When the short-term moving average crosses above the long-term moving average (a “golden cross”), it’s a sign of an uptrend.
Tips for Analyzing Crypto Trading Graphs
Here are a few tips to help you improve your ability to analyze trading graphs effectively:
- Understand Market Trends: Always pay attention to the overall trend (uptrend, downtrend, or sideways market). Trading with the trend can improve your chances of success.
- Look for Patterns: Learning common candlestick patterns and chart formations like head and shoulders, triangles, and double tops can help you predict market movements.
- Combine Multiple Indicators: Don’t rely on just one indicator. Use a combination of tools like RSI, MACD, and Moving Averages to confirm your analysis and increase accuracy.
- Consider Volume: Analyzing trading volume is just as important as analyzing price movements. High volume confirms the strength of a price move, while low volume can indicate a weak trend.
Conclusion: Mastering Trading Graphs for Better Crypto Trading
Analyzing trading graphs is an essential skill for any cryptocurrency trader. Whether you’re a beginner or experienced, understanding how to read candlestick charts, use technical indicators, and identify key patterns will greatly improve your trading strategy. By combining these skills with your market knowledge, you’ll be able to make more informed decisions and stay ahead of the game.
Remember to practice and stay updated with market trends to refine your trading skills. Start using these techniques in your next trades, and over time, you’ll build confidence in analyzing crypto market charts.


